
View Reports
With Project Manager, you can generate reports of your projects, tasks, etc. focusing on various criteria.
To view reports navigate to Project Manager → Reports.
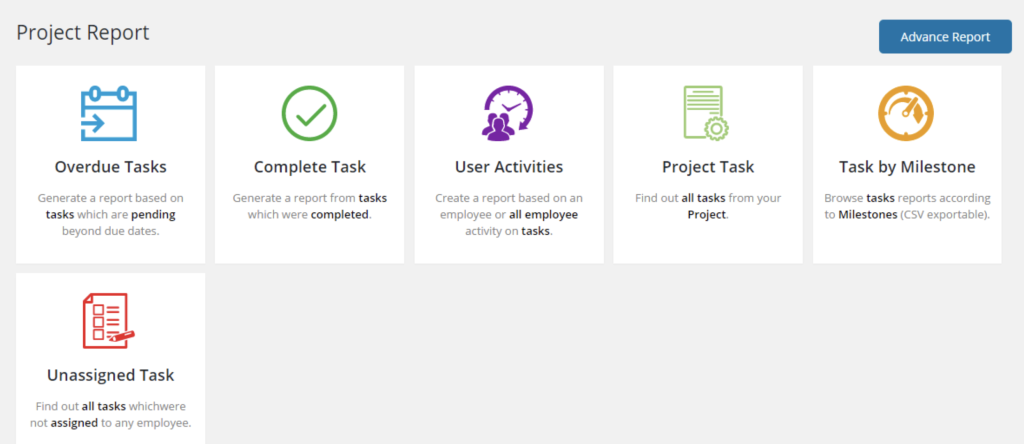
We have added several predefined report cases depending on user feedback. The reports are very much self-explanatory.
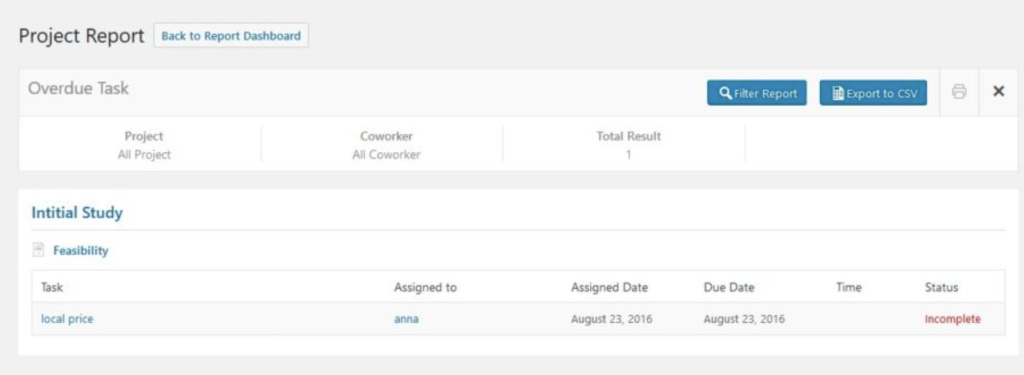
Overdue Tasks
Lists tasks from the project which have passed the due date but not completed yet. Now you can find out which tasks you need to get off from your waiting list first.
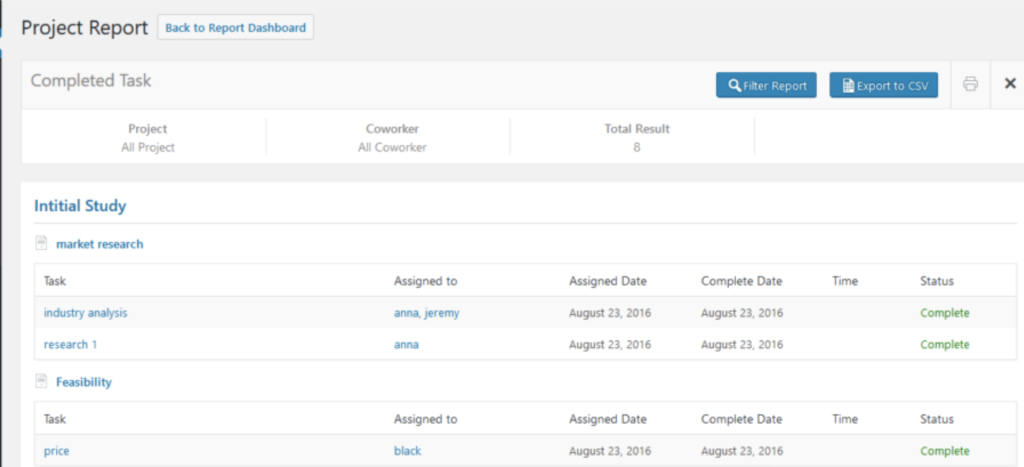
Complete Tasks
Tasks which were completed from all to-do lists. Tasks which you can relax about.
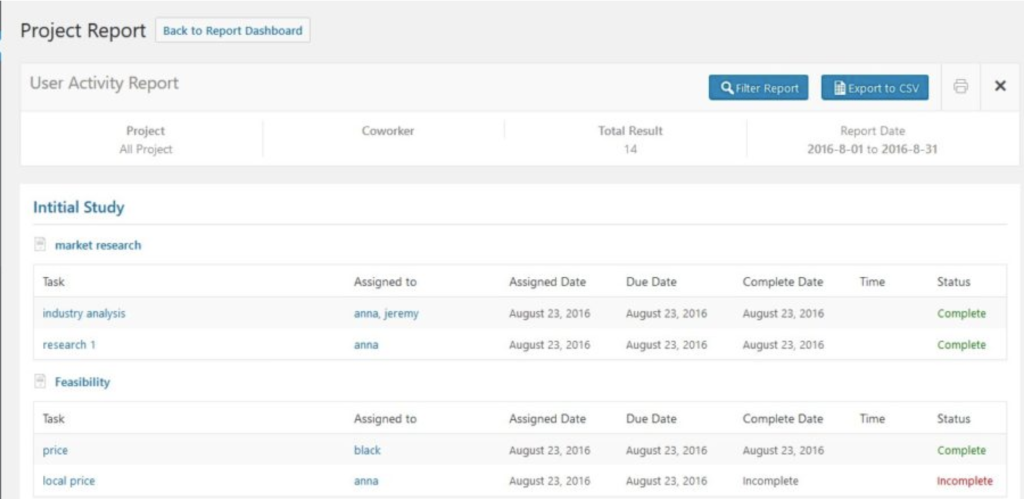
User Activities
A complete review of all the tasks created or deleted by all co-workers. It is also possible to create reports for specific user activities. All you have to do is select the user name and time frame.
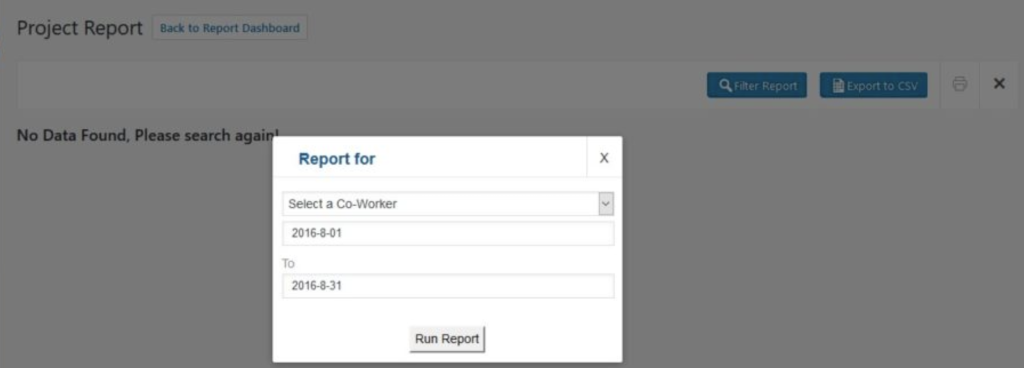
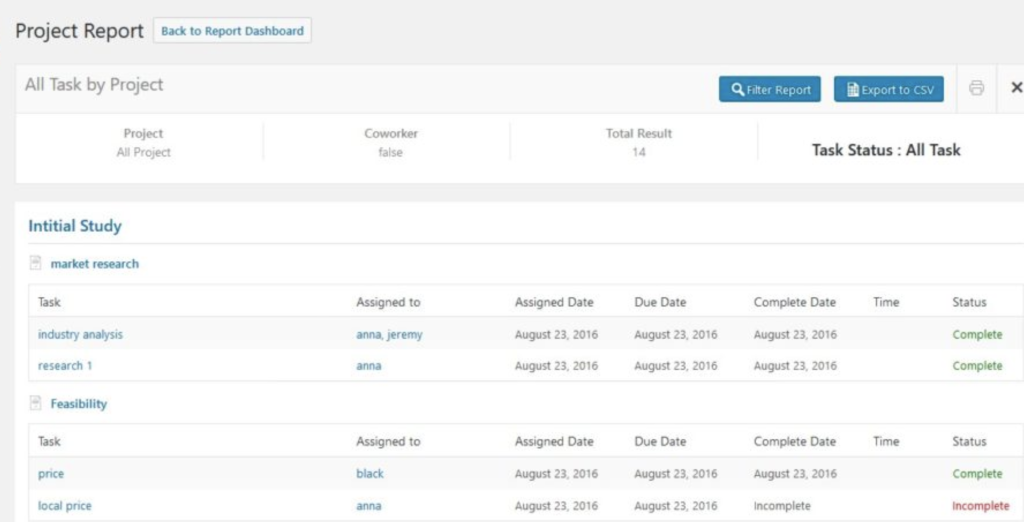
Project Task
A complete report showing all your tasks from projects. You can also generate reports for complete and incomplete tasks. When you select this report a popup with be displayed and you have to choose what kind of report you want to generate and press the Run Report button.

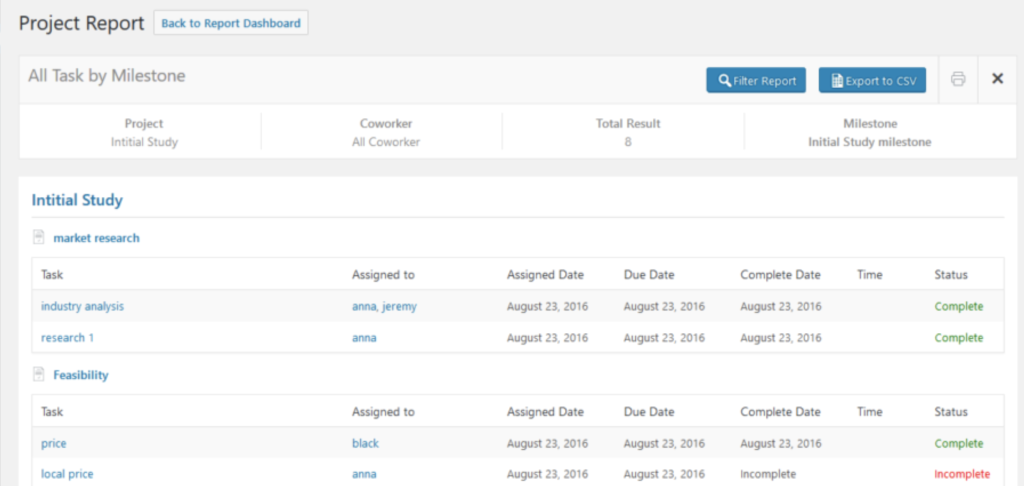
Task by Milestones
Displays all the tasks according to specific milestones. You have to select a project and assigned milestone to generate this report. You can also export this report to CSV file format.

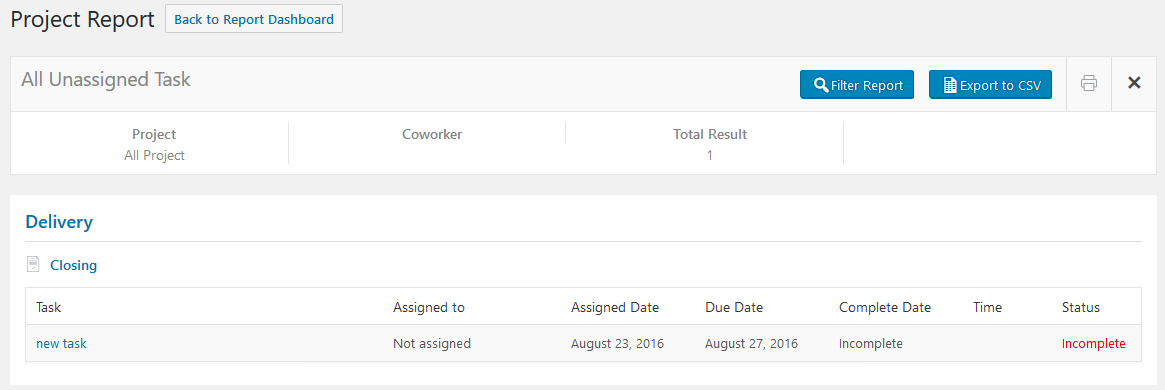
Unassigned Task
This report lists all the tasks which were not assigned to any of the users.
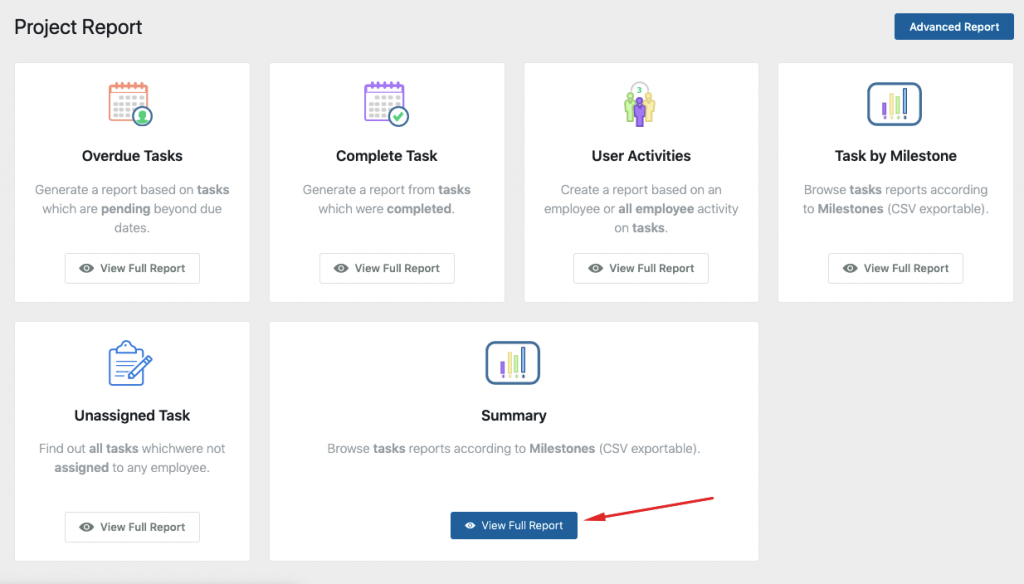
Summary
This report will help you give a snapshot of your projects’ every aspects. The most amazing thing is that you can customize the attributes of your project report to get the report according to your preferences.
To get the report, hit the ‘View Full Report’ button:
Next, you will need to set the filter of the report. Click on the ‘Filter’ button:
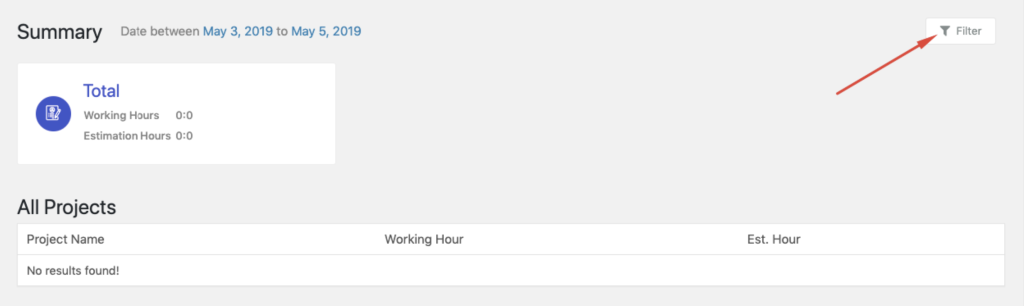
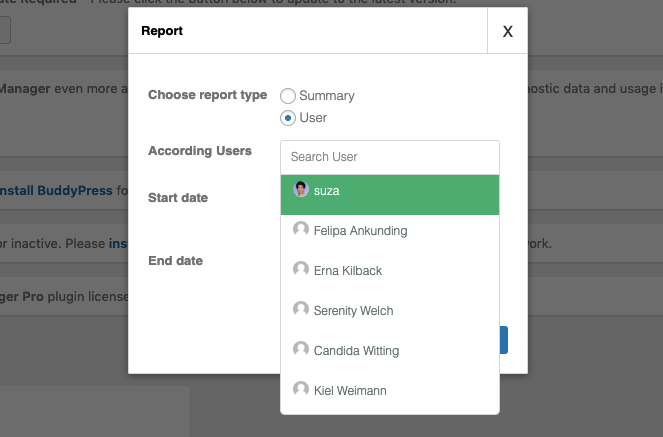
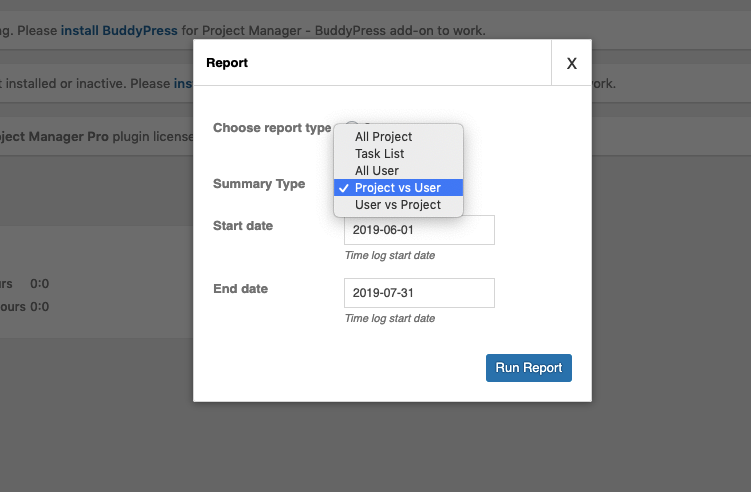
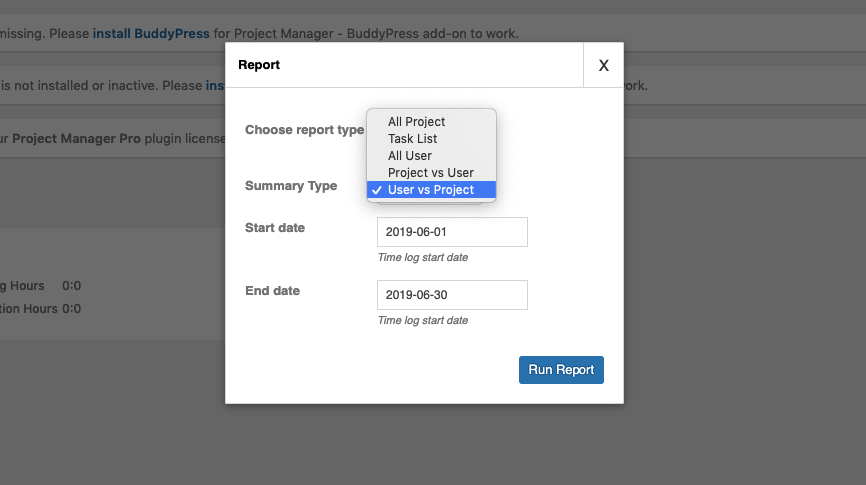
Next, you will get a pop up to set filter option. You will get the following options:
- Report type: By default, it is set to ‘Summary’. However, you can also select the ‘User’ radio button.
- Summary type: To enable this ‘Summary Type’ option, you must select the ‘Summary’ radio button from the ‘Choose report type’ option.
By default, it is set to the ‘All Project’ option. But you can click on the dropdown menu and select either ‘All Project’ or ‘Task List’ or ‘All User’.
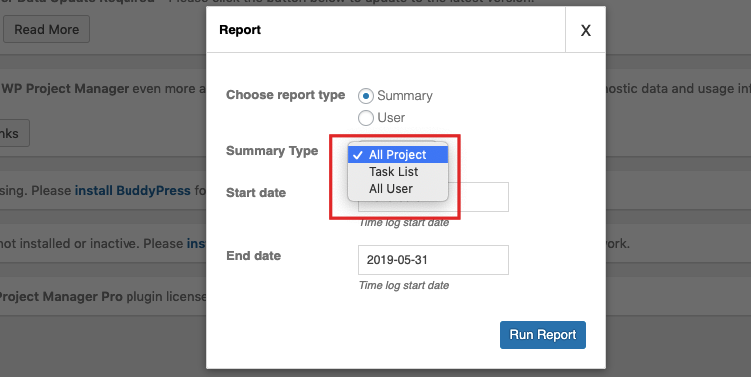
- Start Date and End Date: Set a date range to get report during that period.
How the estimated time report will look like?
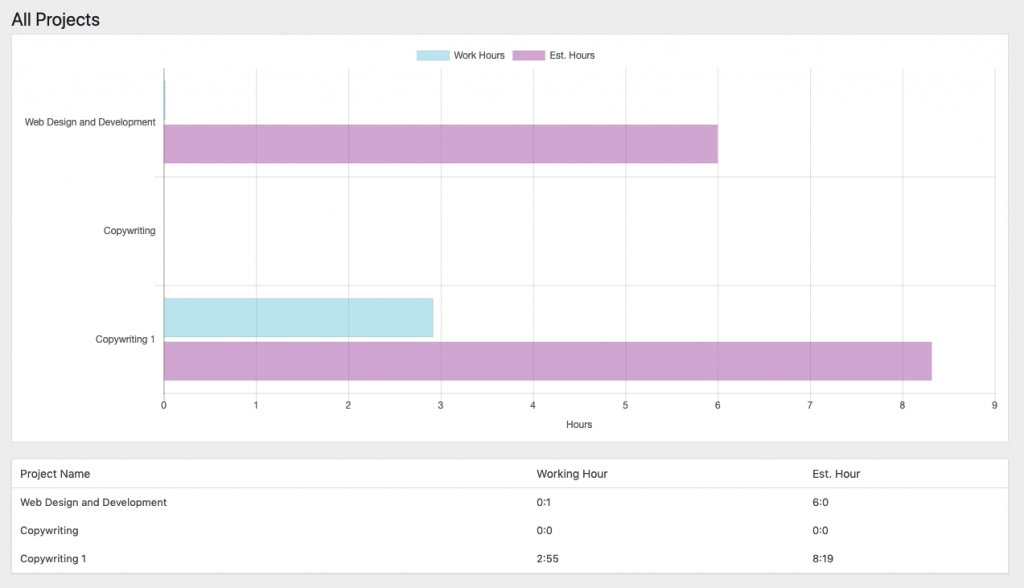
Here is an example of ‘All Projects’ estimated time report based on the ‘Summary’ type:
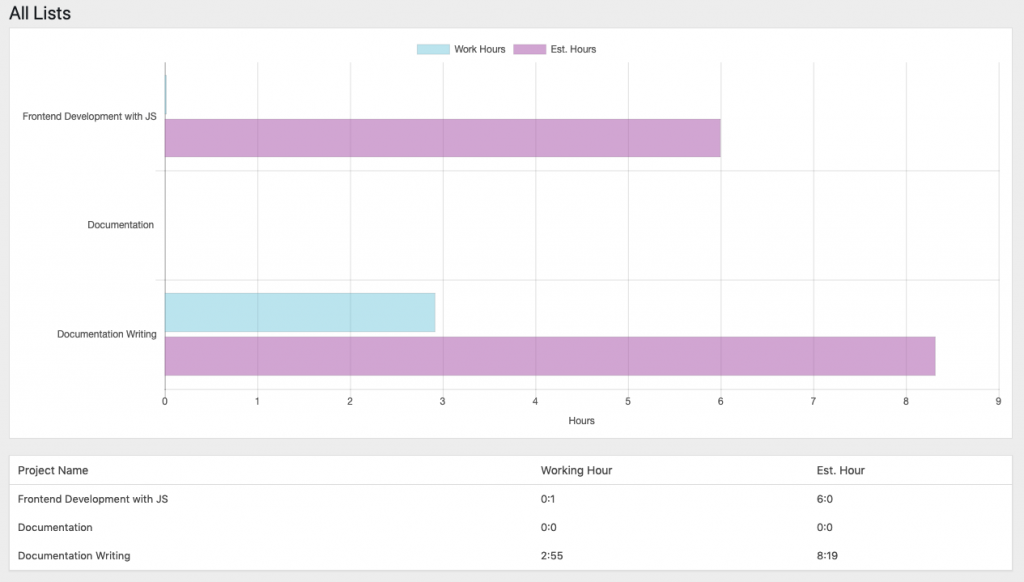
Here is an example of ‘Task List’ report based on the ‘Summary’ type:
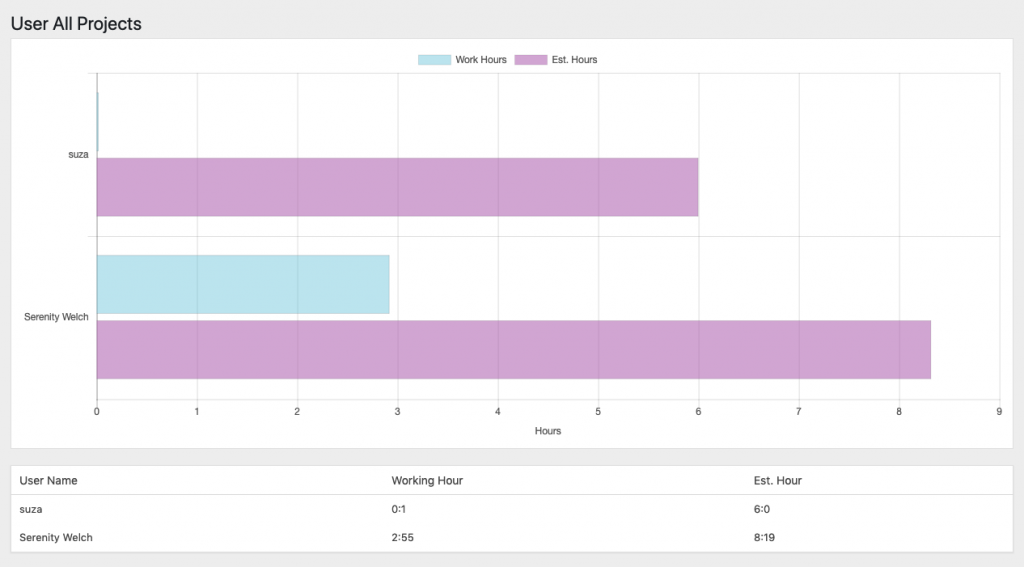
Here is an example of ‘All Users’ estimated time report based on the ‘Summary’ type:
Finally, here is an example of an individual user type based estimated time report:
v2.3.3 Update
With the new release of version v2.3.3, this module will include two more report filter. They are:
- Project vs user
- User vs project
These filters will generate reports with graphical representation.
Project vs user
If you select this option, you will be able to know which user has given how long in their assigned projects. If you hover your mouse pointer on the graph then you will get a tooltip describing the details.

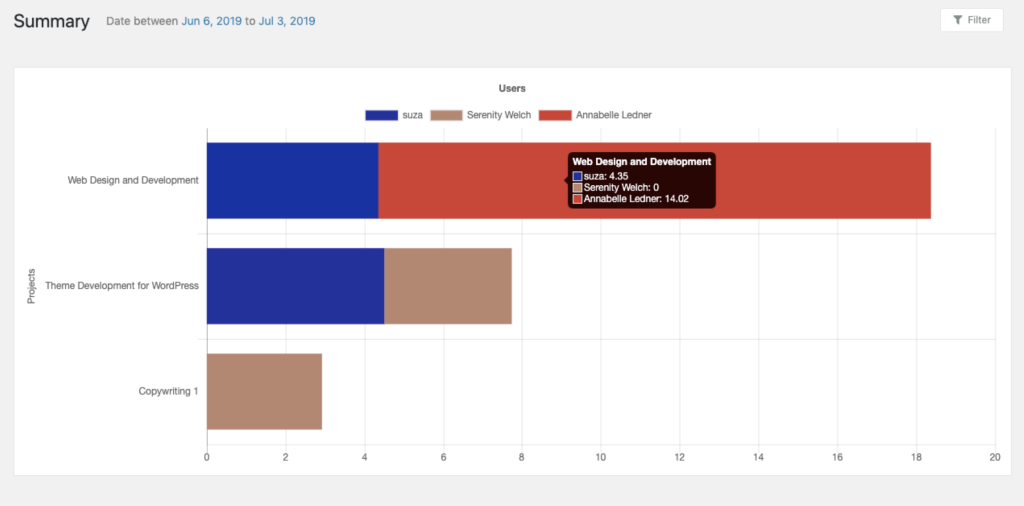
User vs project
If you select this option, you will get to know how many users have spent time on a project. Like project vs user, if you hover your mouse pointer on the graph then you will get a tooltip describing the details.
The advanced report is the old report
We didn’t completely remove our old reporting system because of it complete manual capacities. You can still access it by clicking Advanced report.
In this page, you will be prompted to select a project to generate the report or to export it to a CSV file.
- Use the drop-down menu to select your desired project.
- Use the “+” button for selecting multiple projects.
- Click generate report to view project report(s).
After clicking generate project button, you will see your project reports in details as like Project Name, Task List, Title, Task, Assigned Person’s name, Start Date, Due Date, Status and more in details by clicking on them.

How to Export to CSV
After getting reports, you can export your reports as Excel file for backup. Click “Export to CSV” button and a file will be downloaded.

After download file, you will see it to your browser downloads and download folder on your PC. Now you can open your file to see your projects report just navigate to your download folder and open your desired file and you have done.
